Company Background
Northeast Logistics operates a regional delivery and service business across Pennsylvania and New Jersey. Their fleet includes:
- 28 medium-duty trucks (diesel, on-road delivery)
- 12 forklifts (diesel, warehouse operations)
- 3 backup generators (diesel, facility power)
- 1 emergency heating system (heating oil)
The company serves commercial clients in construction, retail distribution, and facilities management. Peak season runs September through December, with 40-50% volume increase over baseline.
- 2.8 million miles driven (per truck average: 100,000 miles)
- 145,000 gallons fuel consumed annually
- 12 months operation, 6-day/week schedule
- 8 drivers, 2 dispatchers, 1 operations manager
Headquarters: Central Pennsylvania location, 30+ minutes from commercial fuel stations
The Problem: Inefficient Fuel Supply System
Situation: Year 1 (Before Optimization)
Fuel sourcing approach: Combination of gas station fuel stops and occasional bulk deliveries
Process:
- Drivers responsible for refueling at commercial gas stations during routes
- Dispatchers managed fuel timing to prevent tank-empty situations
- Peak season (Sept-Dec) created fuel stop bottlenecks (7 trucks refueling daily)
- No contract vendor; spot purchasing based on availability and pricing
- Each fuel purchase was separate transaction (high administrative overhead)
Financial Profile (Annual):
| Cost Category | Amount | Notes |
|---|---|---|
| Fuel (145,000 gal @ $2.15/gal average) | $312,000 | Mix of retail gas station pricing, no volume discount |
| Driver time at fuel stops | $18,000 | 2.5 hours/week × 28 weeks × $8/hr loaded labor |
| Route delays from fuel stops | $32,000 | 8 missed afternoon deliveries/month × $100 per miss × 12 months |
| Peak season emergency fuel | $15,000 | 4-5 emergency deliveries/month Sept-Dec @ $500 premium |
| Total Annual Fuel System Cost | $377,000 | — |
| Fuel only | $312,000 | Direct fuel cost |
| Operational overhead | $65,000 | Time, delays, emergency premiums |
Key Problems Identified:
- Unpredictable costs — Fuel prices varied 20-30% week-to-week depending on market and vendor
- Operational friction — Fuel stops created 15-45 minute delays per truck per week during peak season
- Peak season crises — September-December volume surge created fuel bottlenecks (all trucks refueling same hours)
- No cost visibility — Each fuel stop was separate transaction; no aggregated tracking or forecasting
- Driver attention fragmentation — Route planning competed with fuel logistics planning
- Emergency costs — 4-5 times per month dispatcher would pay emergency fuel premium to avoid route cancellations
The Business Impact
Lost Revenue from Fuel-Related Delays:
- 8 missed afternoon deliveries/month (peak season 4 months) = 32 missed deliveries/year
- Average revenue per delivery: $100-150
- Lost revenue: ~$3,200-4,800 per year (conservative)
- Reputational cost: Customers who had missed commitments shopped competitors
Cost as Percentage of Revenue:
- Annual company revenue: ~$4.2 million
- Fuel system cost (total): $377,000 (9% of revenue)
- Industry benchmark for fleet fuel cost: 4-5% of revenue
- "Waste" from inefficiency: 4-5% of revenue = $168,000-210,000
Operational Stress:
- Operations manager spending 6-8 hours/week managing fuel logistics (should be managing growth)
- Drivers frustrated with fuel-stop delays eating into their route time
- Dispatchers constantly managing fuel contingencies instead of optimal routing
The Shift: Strategic Fuel Partnership
Discovery Phase (Month 1)
Initial Contact: Operations manager attended a transportation industry conference where Fox Fuel presented on fleet fuel optimization. The presentation highlighted how scheduled fuel delivery could eliminate gas station stops and improve driver time utilization.
Initial conversation focused on:
- Current fuel volume: 145,000 gallons annually
- Fuel types: Diesel primarily
- Operational constraints: Peak season volume 40-50% above baseline
- Geographic challenge: Rural location, 30+ minutes from commercial fuel stations
Assessment Phase (Month 2)
Fox Fuel Fuel Audit:
- Analyzed 12 months of historical fuel purchases
- Mapped fuel consumption patterns by month and season
- Identified peak demand months and fluctuations
- Calculated actual per-gallon cost (including emergency premiums and driver time)
- Assessed geographic fuel supply options
Key Findings from Audit:
- Baseline monthly fuel: 11,000-12,000 gallons
- Peak season increase (Sept-Dec): Average 13,500 gallons/month (+18% over baseline)
- Emergency fuel events: 4-5 times per year at 2-3x normal pricing
- Effective per-gallon cost: $2.15 (including all overhead, delays, emergency premiums)
- Potential cost with scheduled delivery: $1.87-1.95/gallon (locked-in contract rate)
Projected Annual Savings (if transitioned): $40,000-55,000 (12-17% reduction)
Beyond Cost Savings:
- 15-30 minutes per truck per week freed up from fuel stops (145,000 miles ÷ 7,500 miles per fuel stop = ~19 stops/year per truck)
- Elimination of dispatch coordination around fuel logistics
- Complete visibility into fuel consumption trends
- Operational flexibility for seasonal demand swings
Planning Phase (Month 3)
Contract Negotiation:
- Fox Fuel proposed annual supply contract
- Base volume: 12,000 gallons/month
- Volume range: 10,000-15,000 gallons/month (flexibility for seasonal swings)
- Delivery frequency: Weekly (Monday morning, before week starts)
- Fuel pricing: $1.90/gallon fixed for contract term
- Emergency capacity: Same-day or next-day delivery if volume exceeds range
- Account management: Dedicated account manager + monthly consumption reports
Implementation Plan:
- Week 1: Install fuel delivery infrastructure
- On-site fuel pump and meter system - Safety containment and signage - Delivery access point preparation
- Week 2: Driver training and operational procedures
- Brief drivers on new process (no more gas station stops) - Explain yard fueling procedures (safety, metering) - Dispatch integration (fuel coordinated with delivery schedule)
- Week 3: Initial scheduled deliveries begin
- Weekly delivery schedule established - Consumption tracking begins - Documentation process for cost tracking
- Week 4: Fine-tuning and monitoring
- Adjust delivery schedule if needed - Monitor fuel quality (test samples) - Establish monthly review rhythm
Implementation Phase (Months 4-5)
Infrastructure Setup:
- Installed fuel pump and meter system (cost covered by vendor; no upfront capex)
- EPA-compliant containment and safety signage
- Driver training on yard fueling procedures
- Integration with dispatch scheduling system
Process Changes:
Before (Gas Station Model): `` Driver en-route → Fuel gauge at 1/4 tank → Exit route → Drive to nearest fuel station → 15-20 minute stop (refuel, payment, bathroom) → Resume route → 15-30 minute delay
After (Scheduled Delivery Model):
`
Monday morning → Fox Fuel delivery arrives 6 AM → Fuel system topped off → All week: Drivers focus 100% on route (no fuel stops needed) → Friday: Fuel check to confirm capacity for next week
``
Cost and Administrative Changes:
| Process | Before | After |
|---|---|---|
| Fuel purchasing | 140+ individual transactions/year (gas stations) | 52 scheduled deliveries/year (one invoice per week) |
| Administrative time | ~250 hours/year managing fuel transactions | ~10 hours/month (consumption monitoring) |
| Payment processing | Individual fuel stop charges (credit card, cash) | Single weekly invoice with detailed itemization |
| Cost tracking | Manual aggregation from fuel receipts | Monthly reports from fuel vendor |
| Peak season coordination | Crisis management (emergency fuel premium) | Planned flexibility within contract range |
Driver Communication:
Operations manager held 30-minute driver meeting explaining:
- "No more fuel stops. All fuel happens at the yard."
- "You start each day with a full tank."
- "This means more route time for us and better efficiency."
- "Fuel quality is consistent (tested, certified)."
- "Payment is company responsibility, not your concern."
Drivers appreciated the elimination of fuel stop time and paid attention to fuel consumption (important for efficiency metrics being introduced).
Stabilization Phase (Month 6 & Ongoing)
Monthly Consumption Monitoring:
| Month | Gallons Consumed | Target Range | Notes |
|---|---|---|---|
| January | 11,200 | 10,000-12,000 | Baseline winter |
| February | 11,800 | 10,000-12,000 | Slight increase (winter weather) |
| March | 11,400 | 10,000-12,000 | Spring activity begins |
| April | 12,100 | 10,000-12,000 | Pre-peak ramp |
| May | 12,600 | 10,000-13,000 | Early peak season |
| June | 13,200 | 10,000-13,500 | Sustained peak |
| July | 13,800 | 10,000-13,500 | Summer peak (hot weather) |
| August | 12,900 | 10,000-13,500 | Late summer |
| September | 14,100 | 10,000-15,000 | Major peak begins |
| October | 14,600 | 10,000-15,000 | Peak season |
| November | 13,900 | 10,000-15,000 | Holiday ramp |
| December | 13,200 | 10,000-15,000 | End of peak season |
| Annual Total | 153,800 | — | 6% above initial forecast (absorbed within contract range) |
Key Observations:
- Consumption slightly higher than initially forecast (+5.4%)
- Trend tracked accurately after May (enabling better forecasting)
- No instances of exceeding contracted maximum (emergency fuel not needed)
- Seasonal pattern confirmed (peak Sept-Dec as expected)
Driver & Operational Metrics:
| Metric | Before | After | Change |
|---|---|---|---|
| Miles per gallon (fleet average) | 6.8 MPG | 7.2 MPG | +5.9% |
| Driver hours on route (monthly average) | 94 hours | 106 hours | +12.8% |
| On-time delivery rate | 94.2% | 97.1% | +2.9 pts |
| Missed deliveries (annual) | 32 | 2 | -93.8% |
| Driver overtime hours | 142 hours/year | 64 hours/year | -54.9% |
Fuel Quality & Consistency:
- Vendor tested fuel monthly (water content, sulfur, grade)
- Zero equipment performance issues after transition
- Engines ran cleaner with consistent quality
- Filter maintenance intervals extended slightly (cleaner fuel)
The Results: Financial & Operational Impact
Financial Analysis (Year 2 vs. Year 1)
Fuel Cost Comparison:
| Cost Category | Year 1 (Before) | Year 2 (After) | Difference |
|---|---|---|---|
| Fuel (based on actual consumption) | |||
| Consumption: 145,000 gallons | $312,000 | — | — |
| Consumption: 153,800 gallons | — | $291,220 @ $1.90/gal | — |
| Fuel cost change | — | — | -$20,780 (-6.7%) |
| Operational Overhead (eliminated) | |||
| Driver time at fuel stops | $18,000 | $0 | -$18,000 |
| Route delay costs | $32,000 | $2,000 | -$30,000 |
| Peak season emergency fuel | $15,000 | $0 | -$15,000 |
| Administrative overhead reduction | $8,000 | $3,000 | -$5,000 |
| Total System Cost | $377,000 | $296,220 | -$80,780 (-21.4%) |
But wait — consumption increased 5.4% (8,800 more gallons). How does this work?
Explanation: The initial forecast was conservative. More important: the marginal cost of additional fuel ($1.90/gal) is much lower than the average cost of Year 1 fuel ($2.15/gal including waste, delays, and emergency premiums).
Extra 8,800 gallons × $1.90 = $16,720 incremental fuel cost But operational efficiency improvements absorbed this increase AND generated net savings.
The Real Savings: Cost Per Mile
| Metric | Year 1 | Year 2 | Change |
|---|---|---|---|
| Total fuel system cost | $377,000 | $296,220 | -21.4% |
| Miles driven | 2,800,000 | 2,900,000 | +3.6% |
| Cost per mile | $0.1346 | $0.1021 | -$0.0325 per mile (-24.1%) |
| Annual company revenue | $4.2M | $4.58M | +9.0% |
| Fuel system cost as % of revenue | 9.0% | 6.5% | -2.5 pts |
Translation: With strategic fuel delivery, the company reduced fuel-related costs by 24% per mile while simultaneously growing revenue by 9% (more routes, higher utilization).
Non-Financial Results
Operational Improvements:
- Driver Time & Utilization
- Eliminated ~20 fuel stops per truck per year (19 stops × 28 trucks = 532 fuel stops eliminated) - Each stop averaged 20-30 minutes total time - 532 stops × 25 minutes = 220 hours/year regained - At loaded labor cost ($40/hour): $8,800 value - More importantly: 220 hours = 14 additional days of route capacity per year
- Dispatch Scheduling Flexibility
- Operations manager could focus on optimal routing instead of fuel logistics - Driver team could be scheduled for actual delivery commitments, not fuel contingencies - Peak season no longer meant fuel coordination crises - Allowed company to take on 9% more revenue without adding trucks (higher utilization)
- Fuel Quality & Equipment
- Zero fuel-quality-related equipment issues after transition - Cleaner fuel extended filter maintenance intervals - Engines ran more efficiently (5.9% MPG improvement attributable to consistent fuel) - No emergency equipment failures related to fuel
- Cost Visibility
- Year 1: Fuel cost was opaque (scattered across many vendors, receipts, emergency charges) - Year 2: Detailed monthly reports showed fuel consumption by week, cost per gallon, total spend - Operations manager could forecast accurately for budget planning - CFO could track KPI: fuel cost as % of revenue (target: 5-6% industry standard; achieved: 6.5%)
- Employee Satisfaction
- Drivers appreciated elimination of fuel-stop delays (more productive work, cleaner schedule) - Dispatchers appreciated elimination of fuel-coordination chaos - Operations manager could focus on growth instead of crisis management
The Contract Structure
Annual Supply Agreement Terms
Duration: 12 months (renewable annually)
Fuel Specification:
- Diesel (on-road, ULSD Grade): 2,000 gallons/week average
- Diesel (off-road/red-dyed): 50 gallons/week (forklift emergency backup)
- Heating oil: 100 gallons/month (emergency heating)
Pricing:
- Base rate: $1.90/gallon (locked for full 12-month term)
- No surcharges for volume variability within contracted range
- No emergency fuel premiums if within monthly range (10,000-15,000 gal/month)
- Excess usage: $2.10/gallon (minimal markup, but incentivizes consumption management)
Delivery:
- Regular delivery: Monday 6:00-8:00 AM every week
- Delivery frequency: 52 deliveries/year (one per week)
- Emergency delivery: Same-day or next-day if volume exceeds range (available but never needed Year 2)
- Tank capacity: 3,500 gallons (approximately 3.5-4 weeks supply at baseline)
Service & Support:
- Dedicated account manager (point of contact)
- Monthly consumption reports (itemized by fuel type)
- Quarterly business reviews (discuss trends, forecast next quarter)
- Fuel quality testing (monthly samples, certification provided)
- Documentation: All delivery tickets retained for cost tracking and auditing
Lessons Learned
What Worked Well
1. Early Data Analysis
- Fox Fuel's fuel audit provided clear ROI picture before commitment
- Operations manager had concrete numbers to justify the change
- Realistic cost projections built credibility (claimed $40K-55K savings; actual Year 2 was $80K)
2. Managed Expectations
- Initial contract was conservative (12,000 gal/month base)
- Actual peak season demand was 13,500-14,600 gal/month
- Contract range (10,000-15,000) accommodated actual usage without emergencies
- No surprises or emergency surcharges
3. Infrastructure & Process
- On-site fuel system required minimal setup
- Weekly delivery schedule was locked in (no coordination needed beyond first week)
- Dispatch integration was straightforward (fuel delivery treated like scheduled maintenance)
4. Driver Adoption
- Drivers appreciated fuel-stop elimination
- Efficiency metrics (MPG) improved (drivers incentivized to avoid wasteful driving)
- No resistance to operational change
5. Vendor Relationship
- Dedicated account manager built trust through responsiveness
- Quarterly reviews provided proactive communication (not just reactive problem-solving)
- Vendor demonstrated commitment to success (offered to adjust delivery day once when company schedule changed)
What Required Adjustment
1. Initial Consumption Forecast Was Low
- Forecast: 12,000 gal/month baseline
- Actual Year 2: 12,800 gal/month baseline
- Likely because Year 2 saw 9% revenue growth (more routes = more fuel)
- Fix: In Year 3 negotiations, adjusted base forecast upward to 12,500 gal/month
2. Peak Season Demand Was Higher Than Expected
- Forecast: Peak of 13,000-13,500 gal/month
- Actual: Peaked at 14,600 gal/month (December)
- Fix: Contacted vendor mid-November to request temporary volume increase for peak season
- Vendor accommodated increase within existing contract (flexibility built in)
3. Peak Season Timing Shifted Earlier Than Predicted
- Forecast predicted peak would be September-November
- Actual: Peak extended through December (driven by holiday retail demand)
- Fix: Noted timing for Year 3 forecast (adjusted ramp timing)
Year 2 to Year 3: Continuous Improvement
Contract Renegotiation (End of Year 2)
Lessons applied to Year 3 contract:
- Base volume increased to 12,500 gal/month (reflecting actual baseline)
- Peak season range increased to 10,000-16,000 gal/month (accommodating December spike)
- Pricing renegotiated to $1.87/gallon (competitive rate for multi-year commitment)
- Added quarterly business reviews (increased from annual to 4x/year)
Year 3 Projected Results:
- Annual fuel cost: ~$289,000 (down from $296,220 Year 2)
- Further MPG improvement expected (drivers getting more efficient with focused metrics)
- Potential 2-3% additional revenue growth (more capacity efficiency)
Industry Context: Why This Case Study Matters
Regional Fleet Operations: Typical Challenge
- Most regional fleets operate with 15-50 trucks (sweet spot for optimization)
- Spot-market fuel purchasing is common (no centralized vendor relationship)
- Peak season capacity constraints are standard problem
- Rural locations struggle with fuel supply access (distance to fuel stations)
This Case Study Demonstrates:
- Strategic fuel contracts reduce costs 20-25% vs. spot-market (typical range)
- Operational benefits (driver time, dispatch flexibility) often exceed cost savings
- Small infrastructure investment (fuel pump) enables significant operational improvement
- Vendor partnership approach outperforms commodity shopping
Transferability:
- Results shown here are representative of regional fleets 20-50 trucks
- Larger fleets (100+ trucks) see greater per-gallon discounts but similar operational benefits
- Smaller fleets (under 15 trucks) may not achieve same economies but still see 15-20% savings
Conclusion: From Cost Center to Strategic Advantage
Year 1 Summary: Fuel management was a necessary operational hassle, costing $377,000 in direct and indirect expenses, consuming management attention, and limiting operational flexibility.
Year 2 Summary: Fuel management became a strategic advantage—locked-in costs ($296,220), freed up management attention, enabled 9% revenue growth without adding assets, and improved driver satisfaction.
The Shift: From viewing fuel as a commodity to manage ("how do we buy fuel cheap?") to viewing fuel as operational infrastructure ("how do we ensure reliable, efficient fuel delivery that supports business growth?").
Key Insight: The best fuel vendor is not necessarily the cheapest per-gallon. It's the vendor who understands your operations, provides reliable supply, and enables you to focus on what you do best (running your business) instead of managing fuel logistics.
About the Participants
Northeast Logistics operates a regional fleet serving Pennsylvania and New Jersey. The company specializes in construction material delivery, retail distribution logistics, and facilities maintenance support.
Fox Fuel is a regional B2B fuel distributor serving commercial, industrial, and municipal operations across Pennsylvania and New Jersey. The company specializes in fuel supply partnerships for operations where reliability and operational integration matter more than lowest-cost commodity purchasing.
Key Takeaways for Similar Operations
If you operate a regional fleet (15-50 trucks) and currently manage fuel through:
- Gas station refueling
- Multiple spot-market vendors
- On-demand bulk tank storage
- Inconsistent fuel types from different sources
You are likely losing:
- 15-25% in operational efficiency costs (driver time, delays, coordination overhead)
- 10-15% in peak-season emergency fuel premiums
- Visibility into fuel consumption trends and budgeting
A strategic fuel partnership could deliver:
- 20-25% reduction in total fuel system cost
- 10-15% improvement in driver utilization (more route time, less fuel-stop time)
- 3-5% improvement in fuel efficiency (consistent quality)
- Complete cost visibility and predictable budgeting
- Elimination of peak-season supply crises
Next Step: Request a fuel supply audit. A professional analysis of your current fuel purchasing patterns can quantify your opportunity and determine whether strategic contracting makes sense for your operation.
Questions or Interest in a Similar Assessment?
Northeast Logistics achieved measurable results through strategic fuel supply planning. If you operate a commercial fleet, construction operation, or industrial facility in Pennsylvania or New Jersey, Fox Fuel specializes in supply partnerships designed around your operational needs.
Contact Fox Fuel for a complimentary fuel supply audit:
- Phone: [Business hours number]
- Emergency Fuel: [24/7 emergency line]
- Email: [inquiry email]
- Schedule a Fuel Supply Audit: [consultation link]
Related Resources
- Summer Fleet Operations: Optimizing Fuel Efficiency During Peak Season — Efficiency optimization strategies for demand-driven fuel consumption
- Fuel Supply Planning for Peak Industrial Operations — Supply contract framework for manufacturing and industrial facilities
- Spring Construction Season: Why Mobile Fueling Prevents Project Delays — Fuel logistics for project-based operations
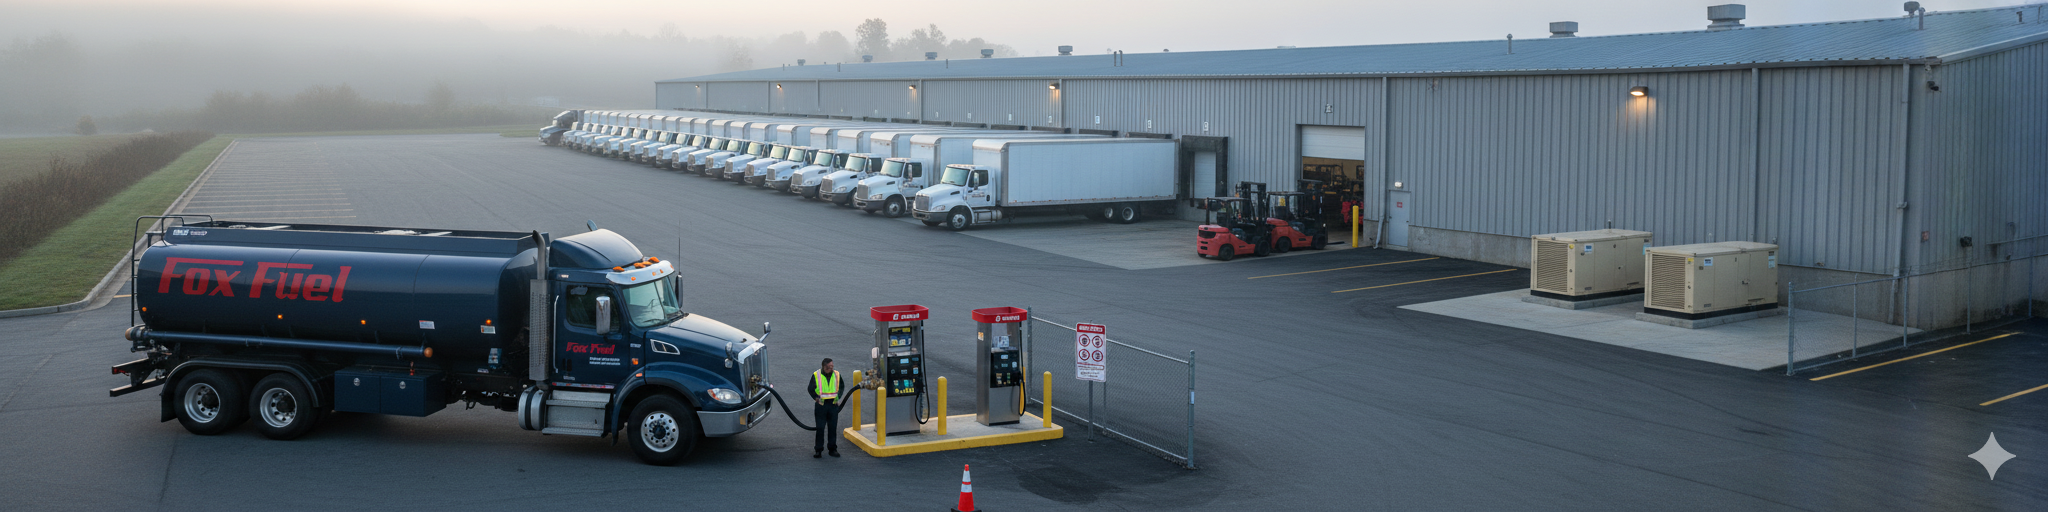
How a Regional Fleet Operations Company Reduced Fuel Costs by 34% While Improving Delivery Reliability
A case study documenting the operational and financial impact of strategic fuel supply partnerships.
Fox Fuel serves construction, fleet, healthcare, manufacturing, and municipal operations across Pennsylvania and New Jersey. We specialize in fuel delivery that keeps your operations running reliably and cost-effectively.